Six Sigma and Lean
Six Sigma is a structured approach to business management that concentrates on improving quality by reducing process variability and eliminating major failure mechanisms. Since it relies heavily on the collection and analysis of data, statistical programs such as Statgraphics and Minitab are a vital component of all serious Six Sigma implementations. Lean Six Sigma adds important concepts from lean manufacturing, which concentrates on the elimination of unnecessary resource utilization.
| Methodology |
| Affinity Diagram |
| Bullet Chart |
| Cause-and-Effect Diagram |
| Cost-of-Quality Trend Analysis |
| FMEA |
| Gantt Chart |
| Monte Carlo Simulation |
| Process Mapping |
| Priority Matrix |
| QFD Matrix |
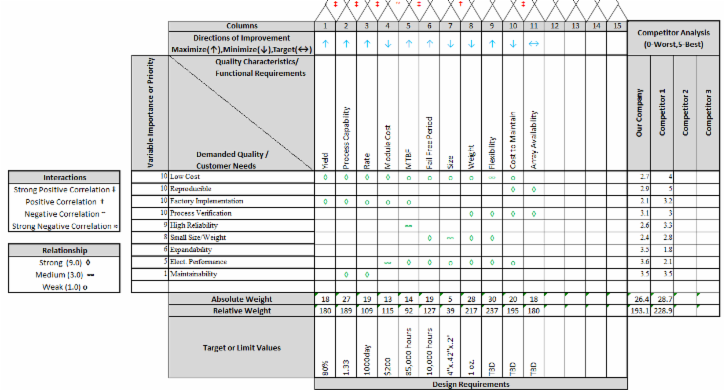
QFD Matrix
The QFD Matrix procedure creates and displays a QFD (Quality Function Deployment) matrix. QFD is a customer-driven planning process by which products and services are matched to the needs of customers. Beginning with a set of customer needs, design requirements are established and the relationships between the needs and requirements identified. A diagram is created to illustrate the plan in a form that is sometimes referred to as the “House of Quality”.
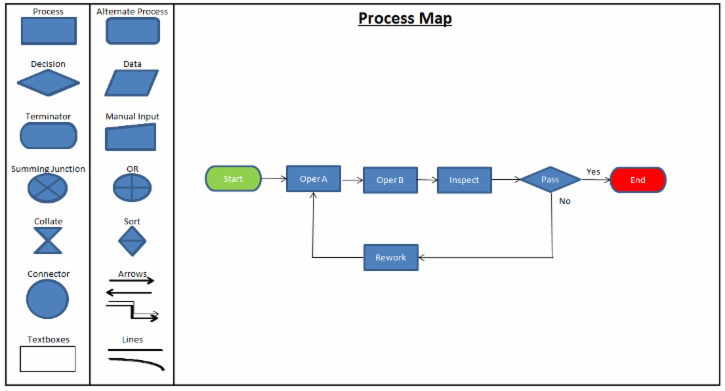
Process Mapping
The Process Mapping procedures are designed to create flow charts, process maps, and other types of step-by-step diagrams. They can be used to map the critical steps involved in process development, in reengineering efforts, in monitoring quality, and in many other areas. They also provide very useful tools for brainstorming sessions.
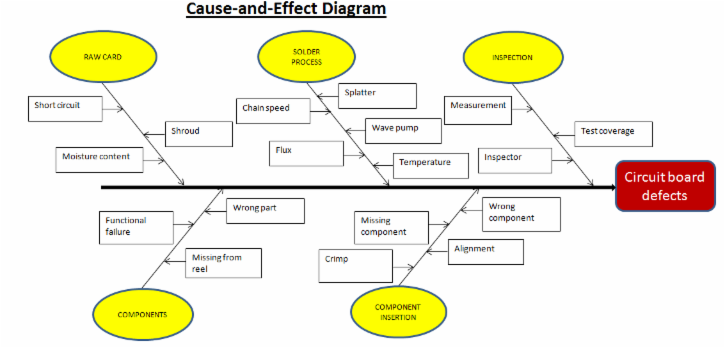
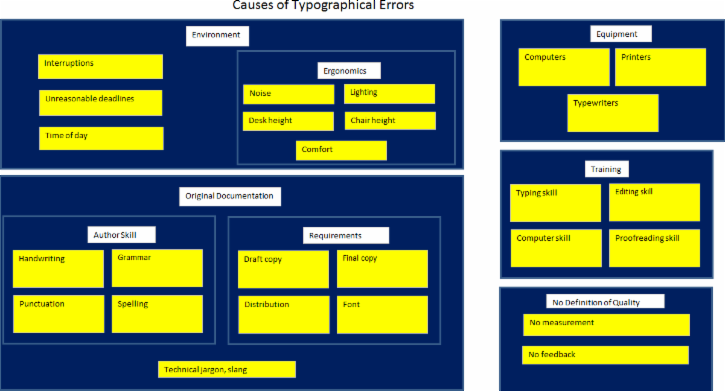
Cause-and-Effect Diagram
The Cause-and-Effect or Fishbone Diagram illustrates the causes of a problem or effect by creating a diagram resembling the skeleton of a fish. It is often used to help identify the factors responsible for a problem that needs to be corrected. The diagram may also be used to display the variables that have an effect on a response that is to be optimized.
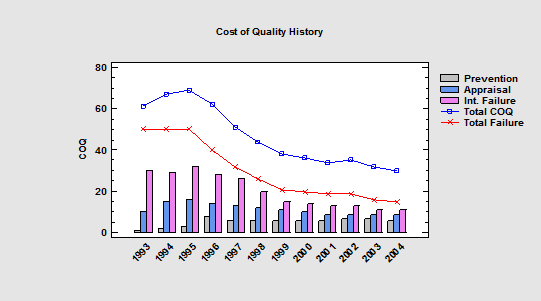
Cost-of-Quality Trend Analysis
The Cost-of-Quality Trend Analysis illustrates the costs of poor quality by constructing a chart displaying prevention, appraisal, and failure costs over time. In addition, statistical runs tests are performed to determine whether or not significant trends exist in any of those time series.
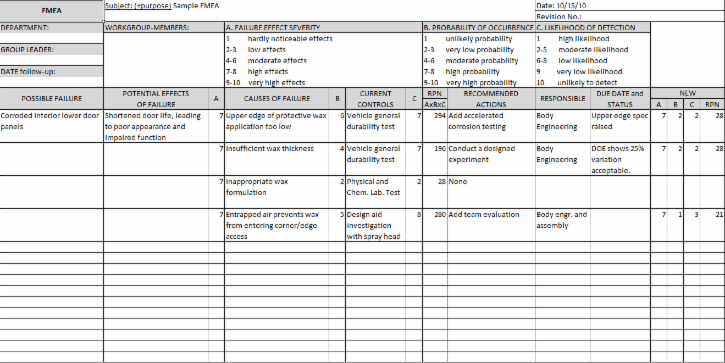
FMEA
Failure Mode and Effect Analysis, commonly referred to as FMEA, is a structured approach to identifying, evaluating, and prioritizing potential failure modes. It takes into account the probability of occurrence of such failures and the seriousness of the possible effects. FMEA also helps identify actions that can be taken to reduce the likelihood and severity of potential failures.
Affinity Diagram
An Affinity Diagram is a tool that may be used to help group ideas or customer requirements into clusters with similar characteristics. When creating an affinity diagram by hand, ideas are usually written first on Post-its™ which are later arranged into groups.
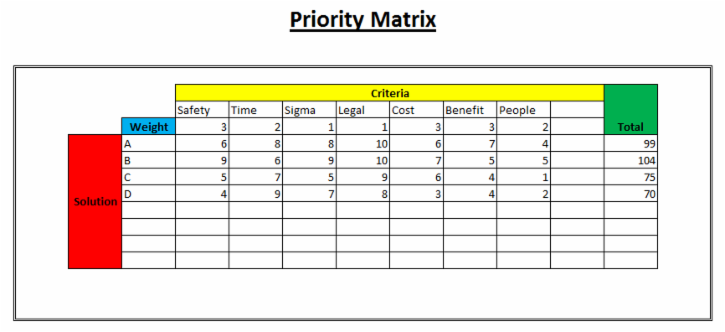
Priority Matrix
A Priority or Prioritization Matrix is used to help choose between alternative solutions. Given a set of criteria, each solution is scored against each criterion and the weighted sums for the solutions are calculated. The solution with the highest scores is judged to be most capable of meeting the criteria.
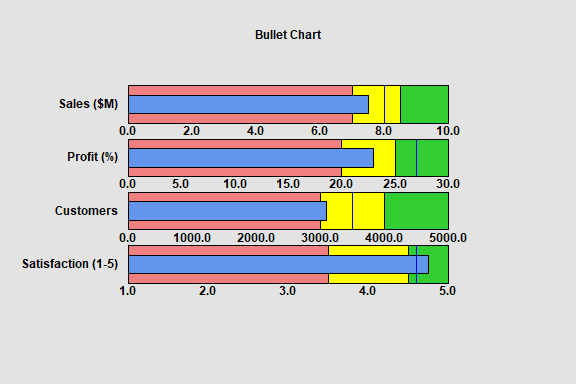
Bullet Chart
The Bullet Chart procedure creates a special type of barchart that is commonly used to display the performance of a process with respect to multiple features. The chart displays the current status of each feature and compares it to a target value. Often, the bars are divided into three regions corresponding to poor, average or outstanding performance. Bullet charts are commonly added to dashboards, since they provide an easily comprehendible summary of multiple features.
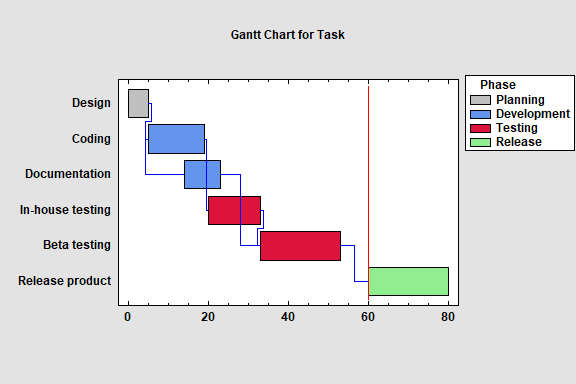
Gantt Chart
The Gantt Chart procedure creates a special type of plot commonly used to display a project schedule. It contains horizontal bars depicting the start and end times of a set of tasks that need to be accomplished to complete the project. It also contains lines showing which tasks need to be completed before other tasks can begin. A vertical line may also be added to the plot representing the current date.
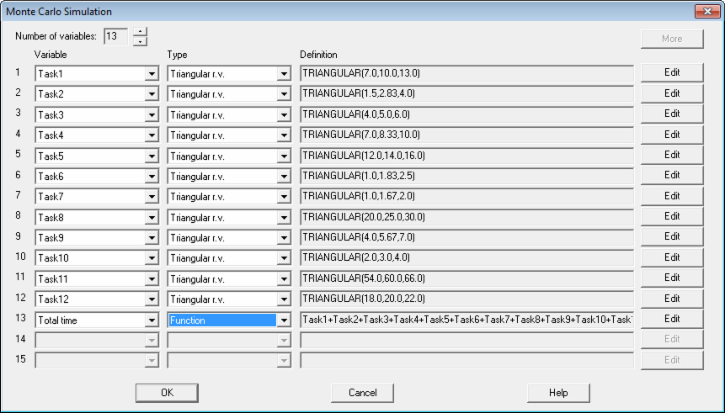
Monte Carlo Simulation
Monte Carlo Simulation is used to estimate the distribution of variables when it is impossible or impractical to determine that distribution theoretically. It is used in many areas, including engineering, finance, and DFSS (Design for Six Sigma). A typical Monte Carlo simulation includes:
- One or more input variables X, some of which usually follow a probability distribution.
- One or more output variables Y, whose distribution is desired.
- A mathematical model coupling the X’s and the Y’s.