Basic Statistical Methods
A wide range of data analytic procedures are available for extracting the essential information from your data. To see what's available, click on a subject area below:
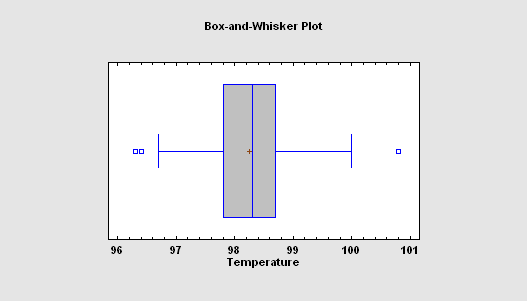
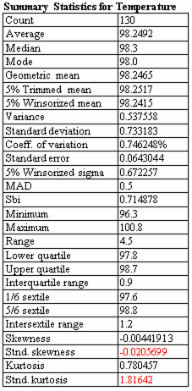
One Variable Analysis
The One Variable Analysis procedure is one of the primary procedures for analyzing a single column of numeric data. It calculates summary statistics and confidence intervals, performs hypothesis tests, and creates a variety of graphical displays. The graphs include a scatterplot, histogram, box-and-whisker plot, quantile plot, normal probability plot, density trace, and symmetry plot. The tables include percentiles and a stem-and-leaf display.
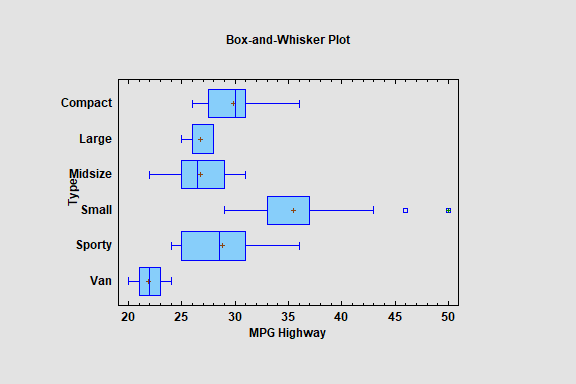
Subset Analysis
The Subset Analysis procedure will calculate statistics for data in a single numeric column when grouped into subsets defined by the identifiers in a second column. It will also plot the statistics by group.
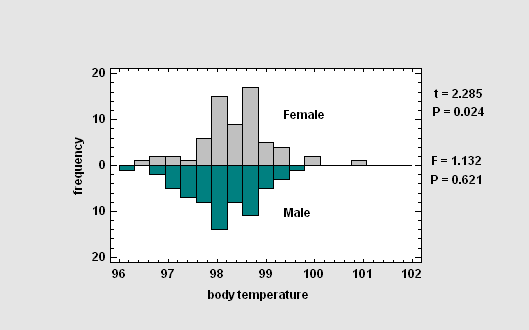
Comparing Two Independent Samples
The Two Sample Comparison procedure is designed to compare two independent samples of variable data. Tests are run to determine whether or not there are significant differences between the means, variances, and/or medians of the populations from which the samples were taken. In addition, the data may be displayed graphically in various ways, including a dual histogram, a multiple box-and-whisker plot, and a quantile-quantile plot.
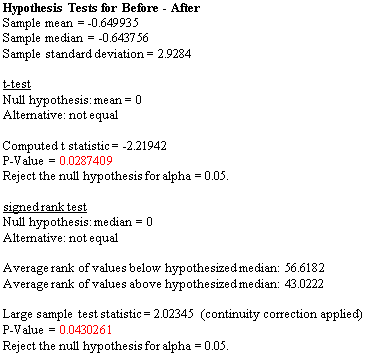
Comparing Two Paired Samples
The Paired Sample Comparison procedure is designed to compare data in 2 numeric columns where the values in each row are paired, i.e., correspond to the same subject or experimental unit. The primary reason for such a comparison is typically to determine whether or not the factor that differentiates the columns has a significant effect on the data.
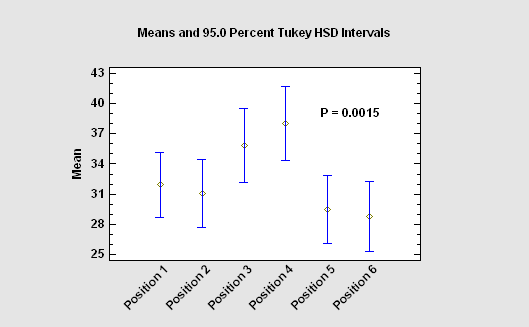
Comparing Multiple Samples
The Multiple Sample Comparison procedure is designed to compare two or more independent samples of variable data. Tests are run to determine whether or not there are significant differences between the means, variances, and/or medians of the populations from which the samples were taken. In addition, the data may be displayed graphically in various ways, including a multiple scatterplot, a means plot, an ANOM plot, and a medians plot.
Comparing Rates and Proportions
Procedures are also available for comparing the observed rates of an event amongst k samples (based on a Poisson distribution), or comparing the observed proportions (based on a binomial distribution). Tests provided include a dispersion test, a chi-square test, and a likelihood ratio test. The procedures also perform an analysis of means (ANOM) to determine which samples differ significantly from the overall average.

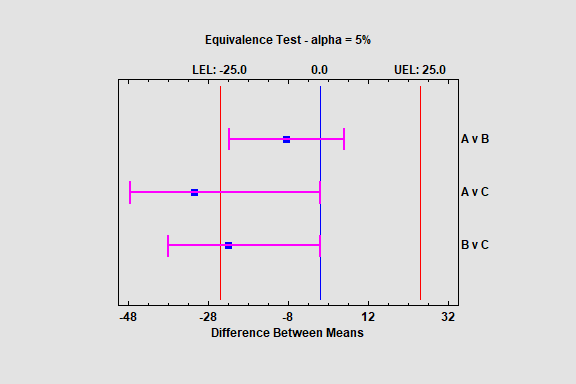
Equivalence and Noninferiority Tests
Statgraphics provides tests to determine whether the means or standard deviations of 2 samples may be considered equivalent. Two samples are considered to be “equivalent” if the difference between their respective means falls within some specified interval surrounding 0 and if the ratio of their standard deviations falls within some specified interval surrounding 1. Unlike standard hypothesis tests which are designed to prove superiority of one method over another, equivalence tests are designed to prove that two methods have essentially the same mean or standard deviation.
The procedures may also be used to demonstrate noninferiority. A sample is considered to be “noninferior” compared to another sample if the difference between their respective means is no greater than a specified value. This situation corresponds to a one-sided test of equivalence.