Machine Learning
Statgraphics contains a large number of procedures for machine learning. Machine learning is a branch of AI (Artificial Intelligence) where algorithms are used to recognize patterns in data. It is used in many fields, including speech recognition, email filtering, medicine, agriculture, and quality assurance.
Three major sets of algorithms are available in Statgraphics:
| Methodology |
| Unsupervised methods for dividing data into clusters. |
| Unsupervised methods for identifying anomalies. |
| Supervised methods for implementing predictive analytics. |
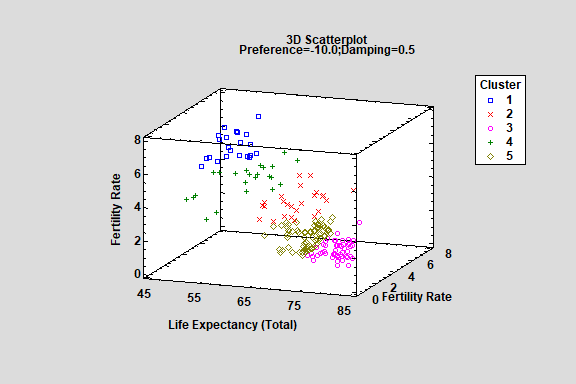
Cluster Analysis
Statgraphics contains 4 procedures for clustering multivariate data:
- Affinity Propagation - The Affinity Propagation procedure implements a machine-learning process to create groups or clusters of multivariate quantitative observations. A distinct advantage of affinity propagation is that it does not require the user to specify the number of clusters. Instead, it searches for exemplars, which are observations that best represent a set of observations that then are placed in a cluster.
- DBSCAN - The DBSCAN procedure (Density-Based Spatial Clustering of Applications with Noise) implements a different machine-learning process to create groups or clusters. It is capable of identifying high-density clusters of arbitrary shapes. Two distinct advantages of DBSCAN over other clustering techniques are: (1) it does not require that the user specify beforehand the number of clusters present in the data; and (2) observations in low-density areas may be classified as noise and not assigned to any cluster.
- K-Means Clustering - The K-Means Clustering procedure implements a machine-learning process that divides data into a pre-specified number of clusters. Clusters are created by grouping observations which are close together in the space of the input variables.
- Spectral Clustering - In spectral clustering, data points are treated as nodes of a graph. The points are projected into a lower dimensional space where the clusters are formed.
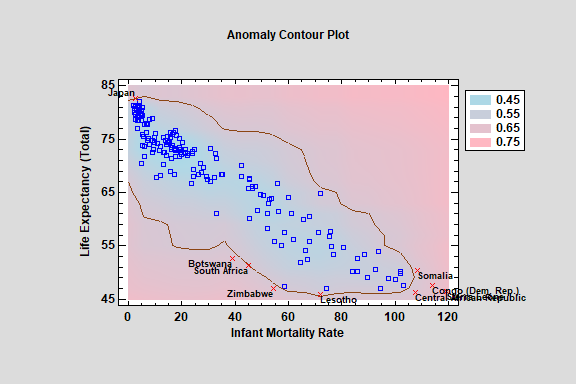
Anomaly (Outlier) Detection
Statgraphics contains 4 procedures for detecting unusual data values:
- Local Outlier Factor
- Isolation Forest
- One-Class SVM
- Grubb's Test
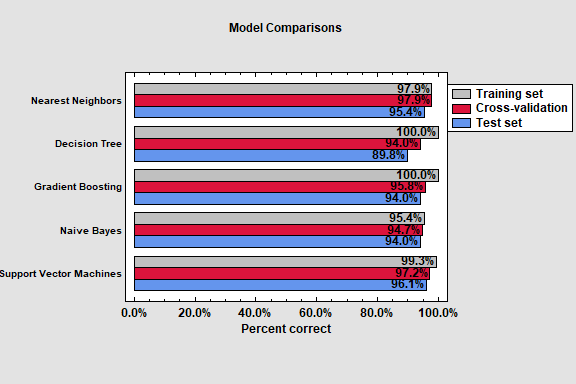
A major addition to Version 20 of Statgraphics is the Supervised Machine Learning Assistant. The Assistant assists users in applying various machine learning procedures contained in the Python Scikit-Learn library designed to create predictive analytic models. It creates models of 2 forms:
1. Classification models that divide cases into groups based on their observed features.
2. Regression models that predict the value of an output variable.
The SML Assistant implements the procedures using a 5-step process:
Step 1: selects the output variable and features that will be considered as predictors.
Step 2: divides the cases into training, test and prediction sets.
Step 3: sets the values of any SML Assistant options.
Step 4: applies one or more of 10 methods for constructing predictive models.
Step 5: uses the models to make predictions for cases in which the output value is unknown.
Decision ForestDecision TreeDiscriminant AnalysisGaussian ProcessGradient BoostingLinear ModelsNaive BayesNearest NeighborsNeural NetworkSupport Vector Machines