Spatial Statistics
Spatial statistics deal with spatial data. There are various types of spatial data including areal (or lattice) data, geostatistical data, point patterns, spatio-temporal data, spatial functional data and mobility data.
| Methodology |
| Demographic Map (Locations) |
| Demographic Map (Regions) |
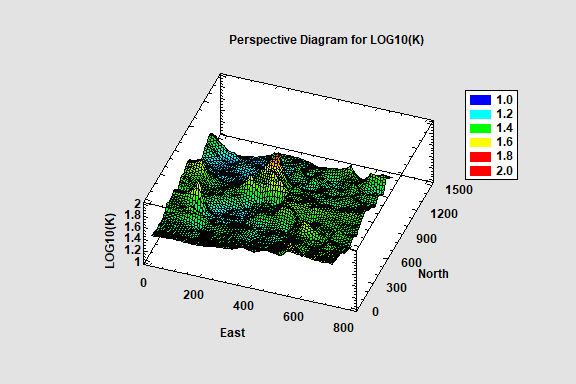
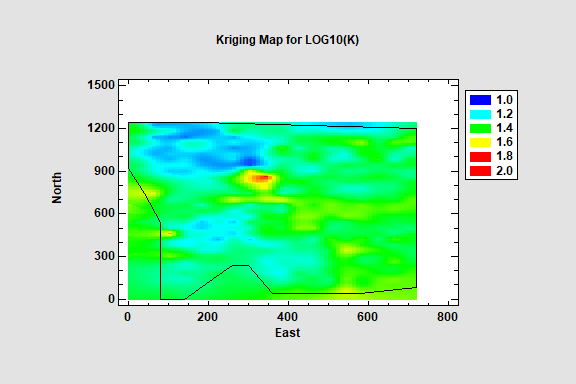
| Kriging |
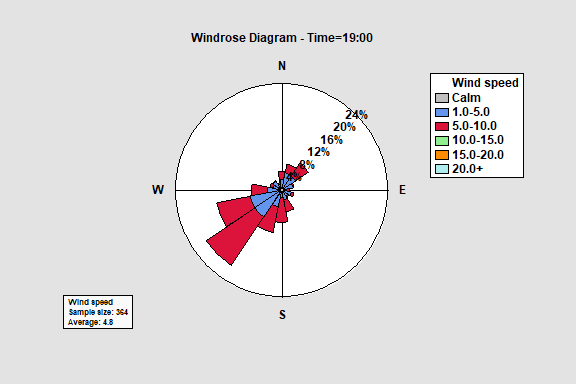
| Wind Rose |
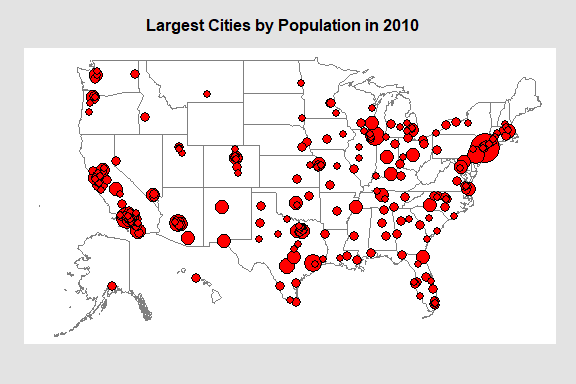
The Demographic Map (Locations) procedure uses bubbles whose size is proportional to the observed data value. It may be used to display many types of data, including:
1. Population and other demographic measurements.
2. Unemployment indices, housing starts, and other economic indices.
3. Environmental statistics.
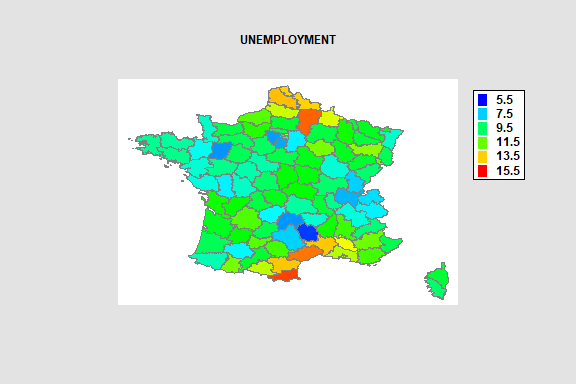
Demographic Map (Regions)
The Demographic Map (Regions) procedure creates a plot of regional boundaries on which each region is color-coded according to the value of a selected attribute or variable. A table is also created summarizing the number of regions falling in each group. If a weighting factor is specified, the sum of the weights in each group is also displayed.
Kriging is a procedure that is widely used to analyze geospatial data. Given a set of measurements taken on a variable at various locations within a two-dimensional region, estimates are derived for the value of that variable throughout the region. The primary output is a map of the estimated value, together with the variance of the estimate.
Wind Rose
The Wind Rose Statlet displays data on a circular plot, depicting the frequency distribution of variables such as wind speed and direction. It may be used to display the distribution at a single point in time, or it may show changes over time in a dynamic manner.