Sample Size Selection
Before collecting data, it is important to determine how many samples are needed to perform a reliable analysis. This requires finding an adequate sample size n so that the statistics to be estimated have a sufficiently small margin of error and that any statistical tests to be performed have the required power.
| Methodology |
| Acceptance Sampling |
| Control Charts |
| MIL-STD |
| One Sample |
| Process Capability Indices |
| Screening Experiments |
| Sequential Sampling |
| Statistical Tolerance Limits |
| Two or More Samples |
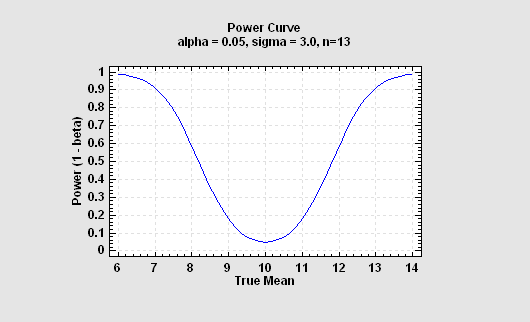
One Sample
Statgraphics will determine required sample sizes for estimating the mean or standard deviation of a normal distribution, the proportion p of a binomial distribution, or the rate parameter of a Poisson distribution. Users may specify either the desired width of a confidence interval for the parameter or the desired power of a one-sided or two-sided hypothesis test.
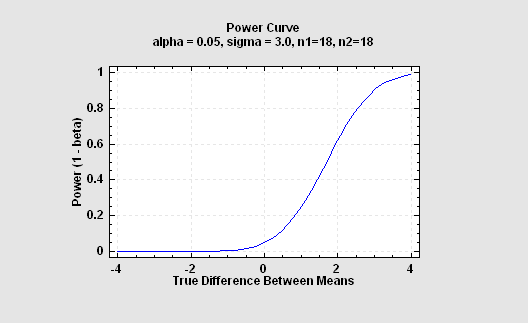
Two or More Samples
Statgraphics will determine required sample sizes for comparing the means or standard deviations of 2 normal distributions, the difference between 2 proportions, or the difference between 2 rates. It can also determine the required sample size when doing pairwise comparisons in a oneway ANOVA.
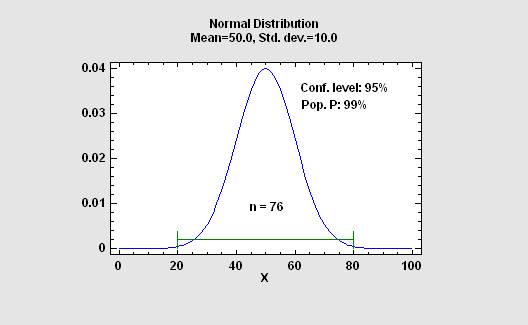
Statistical Tolerance Limits
This procedure determines a suitable sample size for estimating statistical tolerance limits. Statistical tolerance limits give a range of values for X such that one may be 100(1-alpha)% confident that P percent of the population from which a data sample comes falls within that range. This procedure determines sample sizes for several types of limits:
1. Normal tolerance limits
2. Lognormal tolerance limits
3. Weibull tolerance limits
4. Nonparametric limits
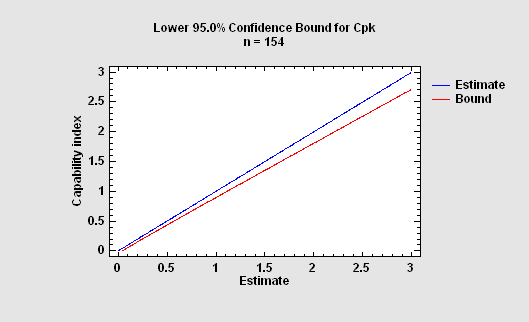
Process Capability Indices
This procedure determines a suitable sample size for estimating three capability indices: Cp, Cpk, and Cpm.
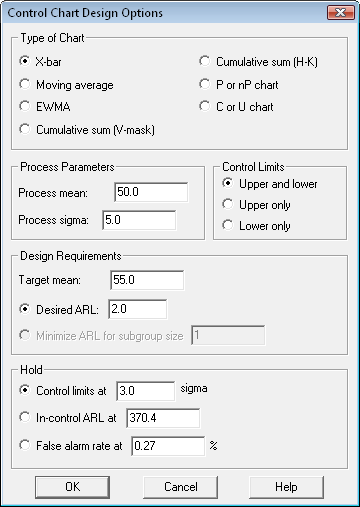
Control Charts
This procedure is designed to help determine the appropriate sample size and parameters for common control charts. The design is based on:
1. the magnitude of a shift away from the centerline that you wish to detect.
2. the average acceptable run length if such a shift occurs before an out-of-control signal is generated.
The procedure is most useful for setting up Phase II control charts, i.e., control charts designed to monitor real-time performance of a process once standard operating conditions have been established. Control charts for both variables and attributes are included.
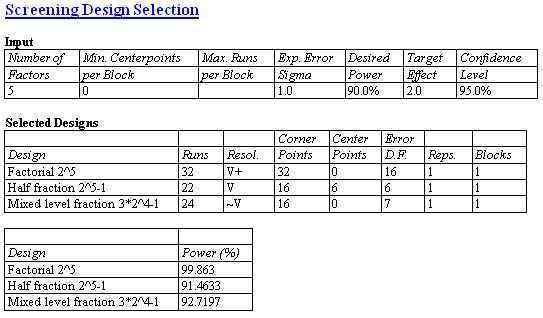
Screening Experiments
The STATGRAPHICS experimental design section can create a wide variety of designs intended to screen out the most important factors affecting a process. Included are two-level factorial designs, fractional factorials, mixed level fractions, irregular fractions, and Plackett-Burman designs. This procedure is designed to help select an appropriate design from that collection, including the number of replicates and centerpoints. Once the desired effect and maximum block size are specified, a list of the best designs of each type is generated. The power curves for each suggested design are also plotted.
Acceptance Sampling
When lots containing a relatively large number of items require inspection, acceptance sampling plans can provide reasonable protection against shipping or receiving an unacceptable fraction of non-conforming items without inspecting 100% of the lot. In an attribute plan, a sample of size n is drawn from a lot of N items and the lot is accepted if the number of non-conforming items in the lot is less than or equal to c. Statgraphics generates acceptance sampling plans for both attributes and variables.
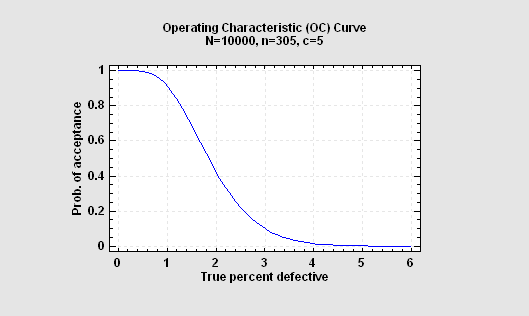
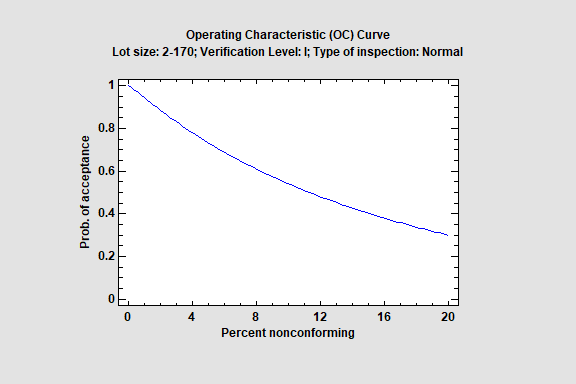
MIL-STD 414, 105E, and 1916
MIL-STD-414 and MIL-STD-1916 are standard sampling methodologies for the acceptance or rejection of lots based on the evaluation of item measurements. A sample of n units is taken from a batch or lot containing N units. If the sample contains no nonconforming units and the sample mean and sample standard deviation yield acceptable quality indices, the batch or lot is accepted. Otherwise, the batch or lot is rejected. To calculate the quality indices, either one or two specification limits for the measurements must be entered.
MIL-STD-105E and MIL-STD-1916 are standard sampling methodologies for the acceptance or rejection of lots based on the evaluation of item attributes. A sample of n units is taken from a batch or lot containing N units. If the sample contains no nonconforming units, the batch or lot is accepted. Otherwise, the batch or lot is rejected. Such a plan is often referred to as a “zero acceptance number sampling plan”.
The MIL-STD-1916 standard specifies the appropriate sample sizes for different verification levels, which are usually specified by contract. It also contains rules for switching between normal inspection, tightened inspection, and reduced inspection, based on the results of recent samples.
These procedures calculate the required sample sizes. They also plot operating characteristic curves to compare alternative sampling plans.

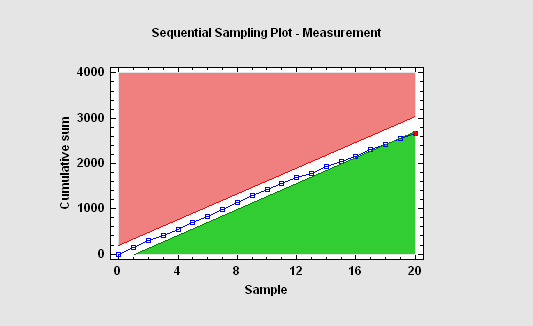
Sequential Sampling
The Sequential Sampling procedure implements various Sequential Probability Ratio Tests (SPRTs). Unlike statistical tests which have a fixed sample size, the number of samples required by sequential tests is not predetermined. Instead, after each sample is taken, one of 3 decisions is made:
1. Stop the test and reject the null hypothesis.
2. Stop the test and accept the null hypothesis.
3. Continue sampling.
In many cases, the SPRT will come to a decision with fewer samples than would have been required for a fixed size test.