Process Capability Analysis
An important technique used to determine how well a process meets a set of specification limits is called a process capability analysis. A capability analysis is based on a sample of data taken from a process and usually produces:
1. An estimate of the DPMO (defects per million opportunities).
2. One or more capability indices.
3. An estimate of the Sigma Quality Level at which the process operates.
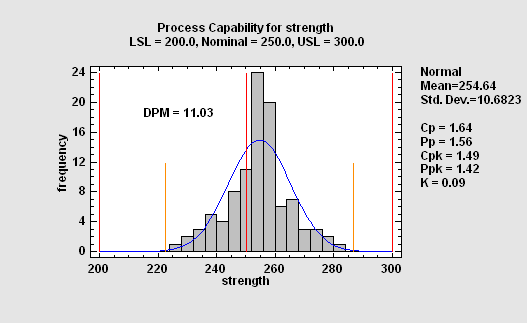
Capability Analysis for Measurement Data from a Normal Distribution
This procedure performs a capability analysis for data that are assumed to be a random sample from a normal distribution. It calculates capability indices such as Cpk, estimates the DPM (defects per million), and determines the sigma quality level (SQL) at which the process is operating. It can handle two-sided symmetric specification limits, two-sided asymmetric limits, and one-sided limits. Confidence limits for the most common capability indices may also be requested.
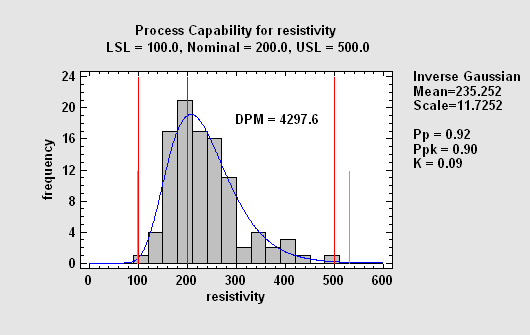
Capability Analysis for Measurement Data from a Non-Normal Distribution
This procedure performs a capability analysis for data that are not assumed to come from a normal distribution. The program will fit up to 25 alternative distribution and list them according to their goodness-of-fit. For a selected distribution, it then calculates equivalent capability indices, DPM, and the SQL.
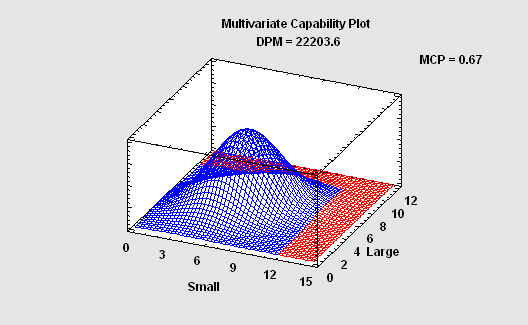
Capability Analysis for Correlated Measurements
When the variables that characterize a process are correlated, separately estimating the capability of each may give a badly distorted picture of how well the process is performing. In such cases, it is necessary to estimate the joint probability that one or more variables will be out of spec. This requires fitting a multivariate probability distribution. This procedure calculates capability indices, DPM, and the SQL based on a multivariate normal distribution.
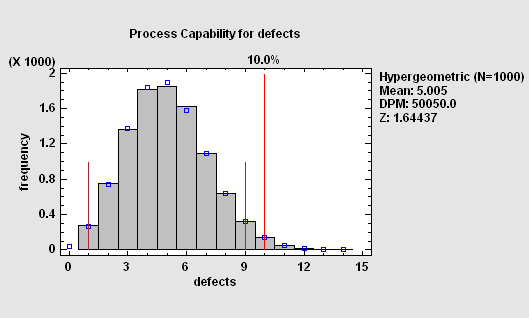
Capability Analysis for Counts or Proportions
When examination of an item or event results in a PASS or FAIL rather than a measurement, the capability analysis must be based on a discrete distribution. For very large lots, the relevant distribution is the binomial. For small lots or cases of limited opportunities for failure, the hypergeometric distribution must be used.
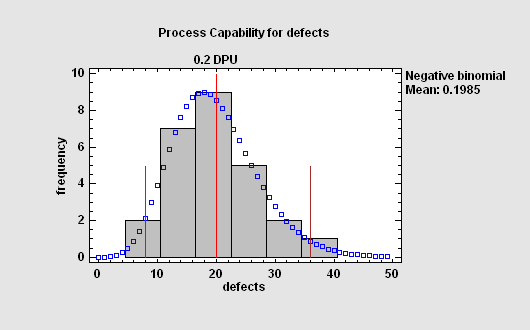
Capability Analysis for Rates
When the relevant measure of performance is a rate, then the capability analysis is based on: a Poisson distribution if failures occur randomly; a negative binomial distribution if failures tend to occur in clumps.
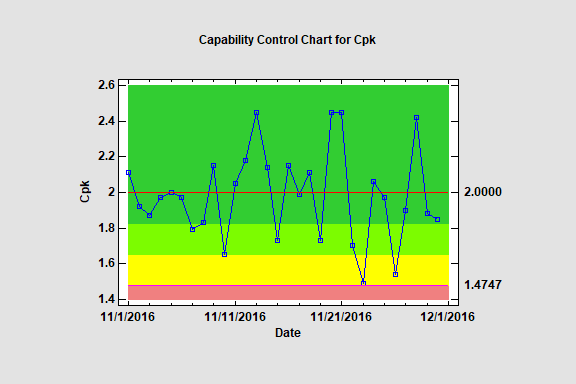
Capability Control Chart
This procedure constructs Phase II statistical process control charts for monitoring capability indices such as Cp and Cpk. Given a process that is deemed to be capable of satisfying stated requirements based on the analysis of variable data, these charts monitor continued compliance with those requirements.
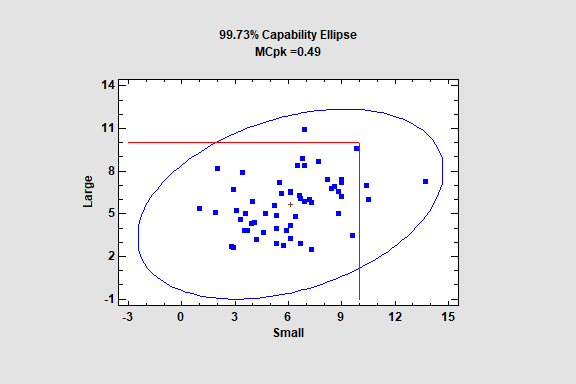
Multivariate Capability Analysis
The Multivariate Capability Analysis procedure determines the probability that items characterized by two or more variables meet established specifications limits. When variables are correlated, it is important to consider their joint behavior, since looking at each variable separately may give a misleading picture of the overall process capability.
Empirical Capability Analysis
The Empirical Capability Analysis procedure may be used to estimate process capability based on the empirical quantiles of the data without assuming any particular distributional form. Nonparametric capability indices called Cnp and Cnpk replace the usual parametric estimates Cp and Cpk.

Nonstationary Capability Analysis
The Nonstationary Capability Analysis procedure may be used to analyze processes in which the mean and standard devation change over time. This is done using a moving window that estimates the process parameters at time t using the q nearest neighbors. It is implemented as a Statlet, allowing the user to dynamically change the value of q. The results are moving estimates of Cpk, DPM and SQL.
