Life Data Analysis and Reliability
Determining the reliability of manufactured items often requires performing a life test and analyzing observed times to failure. Such data is frequently censored, in that some items being tested may not have failed when the test is ended. In addition, it may be necessary to accelerate failure times by changing the value of an influential variable such as temperature. For all of these reasons, special tools are needed to deal with this type of data.
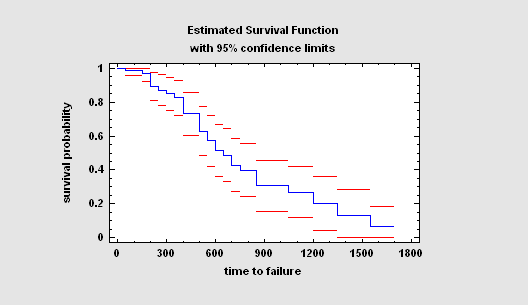
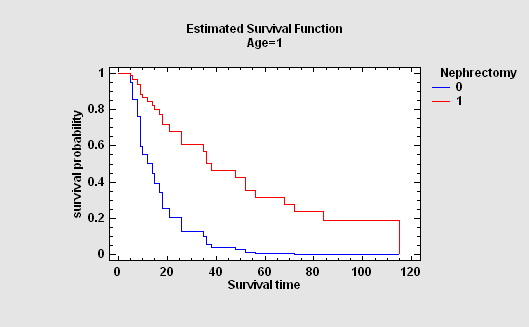
Life Tables
In analyzing life data, interest commonly centers on estimating the probability that a unit will still be operating at any given time. A common way of estimating this survival function, without making any assumption about functional form or error distribution, is to tabulate the data and calculate the survivor function directly from the observed failures. When censoring is present, the estimates are calculated using the Kaplan-Meier approach.
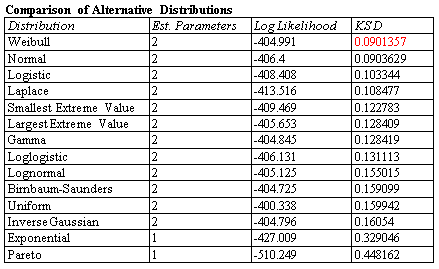
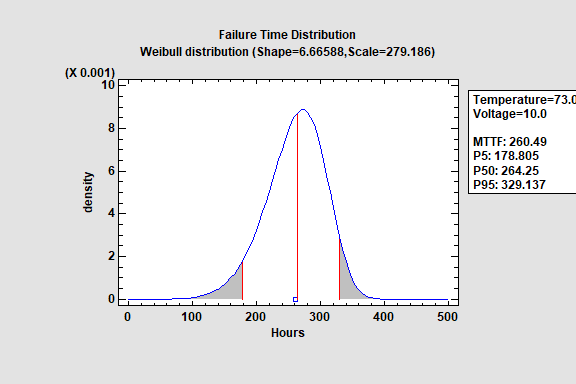
Distribution Fitting with Censored Data
If sufficient data is available, it may be possible to fit a specific distribution to the failure times. Maximum likelihood methods can be easily adapted to the presence of censored data. STATGRAPHICS will automatically fit up to 45 probability distributions for any sample of data and rank them according to goodness-of-fit.
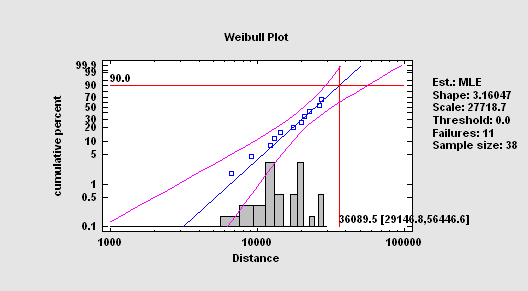
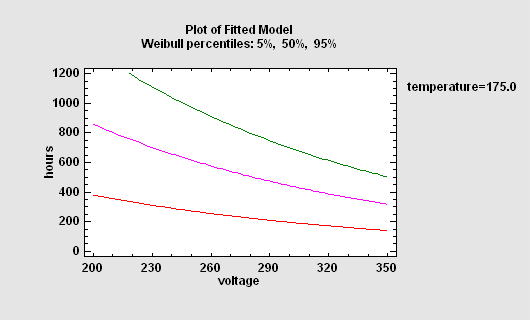
Weibull Analysis
Experience has shown that failure data can often be well modeled by a Weibull distribution. A common method to check the fit of a Weibull distribution is through a Weibull plot. Uncensored failure times should fall approximately along a straight line. In the Statgraphics Weibull Plot, you may add a histogram of censored failure times and confidence limits for failure percentiles.
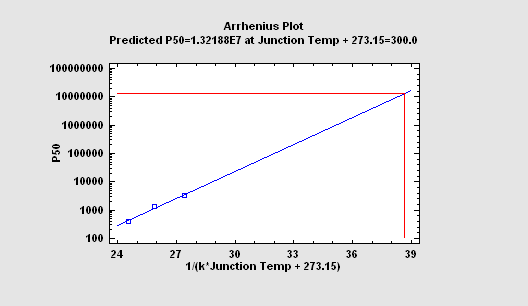
Accelerated Life Test Plots
The Accelerated Life Test Plots procedure is designed to plot data from an accelerated life test in which failure times have been recorded and the mean time to failure (MTTF) or a selected percentile has been estimated at a number of different levels of an accelerating variable. The MTTF or percentile P is assumed to follow one of several commonly used acceleration models. Given estimates at two or more levels of the accelerating variable, the procedure will fit the selected model and extrapolate the MTTF or percentile to a normal operating level. There are 6 model forms available: Arrhenius, inverse power rule, exponential, Eyring, linear and reciprocal.
Accelerated Life Testing
The Accelerated Life Test Plots procedure is designed to plot data from an accelerated life test in which failure times have been recorded and the mean time to failure (MTTF) or a selected percentile has been estimated at a number of different levels of an accelerating variable. The MTTF or percentile P is assumed to follow one of several commonly used acceleration models. Given estimates at two or more levels of the accelerating variable, the procedure will fit the selected model and extrapolate the MTTF or percentile to a normal operating level. There are 6 model forms available: Arrhenius, inverse power rule, exponential, Eyring, linear and reciprocal.
Life Data Regression
To describe the impact of external variables on failure times, regression models may be fit. Unfortunately, standard least squares techniques do not work well for two reasons: the data are often censored, and the failure time distribution is rarely Gaussian. For this reason, STATGRAPHICS provides a special procedure that will fit life data regression models with censoring, assuming either an exponential, extreme value, logistic, loglogistic, lognormal, normal or Weibull distribution.
Cox Proportional Hazards
The Cox Proportional Hazards procedure is an alternative method for fitting a life data regression without assuming any specific distributional form. Instead, it is assumed that the predictor variables affect the hazard function in a multiplicative manner. Like the parametric life data regression procedure, the predictor variables can be either quantitative or categorical.
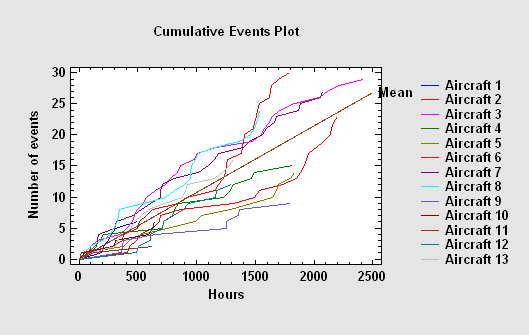
Analysis of Repairable Systems
The Repairable Systems procedures are designed to analyze data consisting of failure times from systems that can be repaired. It is assumed that when the system fails, it is immediately repaired and placed in service again. Further, it is assumed that the repair time is negligible compared to the time between failures. The goal of the analysis is to develop a model that can be used to estimate failure rates or quantities such as the MTBF (mean time between failures). This procedure differs from the Distribution Fitting and Weibull Analysis procedures in that it allows for a failure rate that changes as the system ages.