Nonparametric Methods
Nonparametric methods are used to analyze data when the distributional assumptions of more common procedures are not satisfied. For example, many statistical procedures assume that the underlying error distribution is Gaussian, hence the widespread use of means and standard deviations. When the error distribution is not known, nonparametric procedures may be safer to apply.
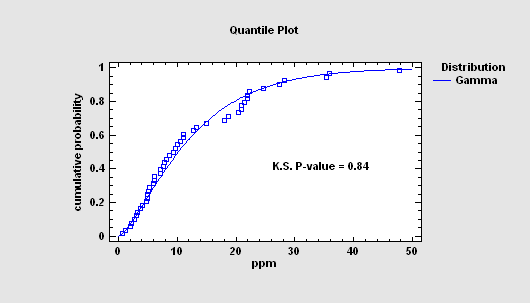
Goodness-of-Fit Tests
Goodness-of-fit tests are used to compare the frequency of occurrence of observations (either quantitative or categorical) to a probabilistic model. Specific tests include the chi-square goodness-of-fit test, the Kolmogorov-Smirnov test, and the Anderson-Darling test.
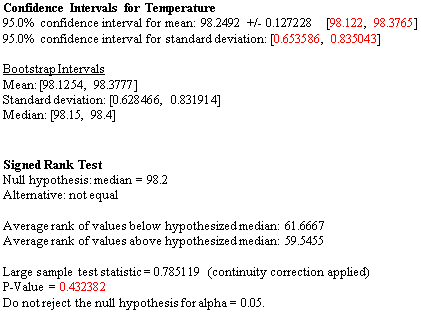
Inferences in One Sample or Paired Samples
When data are collected from a single population or as paired samples from two populations, it is often necessary to estimate and test the parameters of those populations. The One Variable Analysis procedure will test the value of a population median or the difference between 2 medians using either a sign test or a signed rank test. It will also create interval estimates of the mean, standard deviation and median using bootstrapping, a process in which estimates are obtained by creating many new samples from the observed data values.
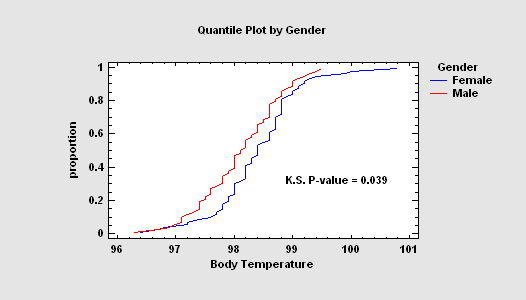
Comparing Two Samples
When data are collected from two populations by taking independent samples, test statistics can be created without assuming that observations from the populations are normally distributed. The Two Sample Comparison procedure performs a Mann-Whitney (Wilcoxon) test to compare the medians and a two-sided Kolmogorov-Smirnov test to compare the entire distributions.
Comparing Multiple Samples
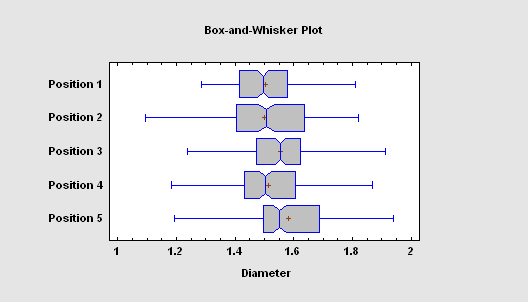
When data are collected from more than two populations, the Multiple Sample Analysis procedure can test for significant differences between the population medians using either a Kruskal-Wallis test, Mood's median test, or the Friedman test. It can also create notched box-and-whisker plots, which have the property that any 2 samples with median notches that do not overlap demonstrate a statistically significant difference between their respective population medians.
Correlation Analysis
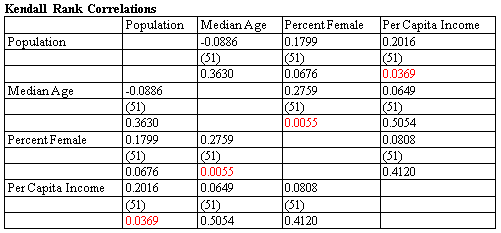
The Multiple Variable Analysis procedure will calculate correlations between pairs of variables using the Pearson product-moment correlation coefficients, or rank correlations using either Kendall's or Spearman's method. The table at the right shows estimated correlations, sample size and approximate P-values for 4 demographic variables.
Tests for Association
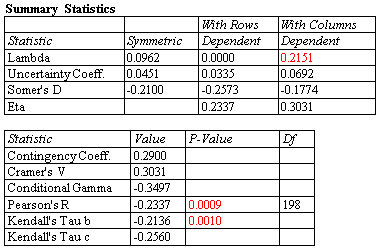
For categorical data, various measures of association between the levels of two factors may be calculated in the Contingency Tables procedure. The table at the left shows statistics for a typical 2-by-2 table.
Tests for Randomness
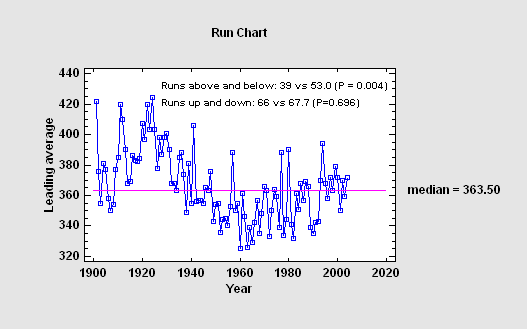
For sequential data, run tests may be performed to determine whether or not the data come from a random process. The Run Charts procedure performs tests by counting the number of runs above and below the median, and by counting the number of runs up and down.
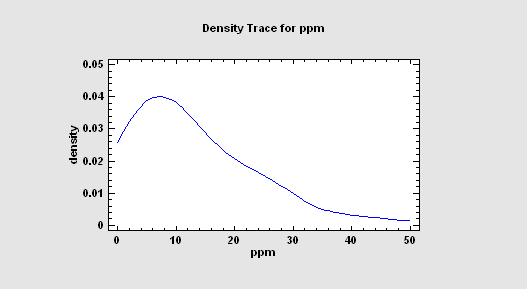
Density Estimation
Several procedures in Statgraphics calculate a density trace. Given a single column of continuous numeric data, the density trace provides a nonparametric estimate of the probability density function of the population from which the data were sampled. It is created by counting the number of observations that fall within a window of fixed width moved across the range of the data.
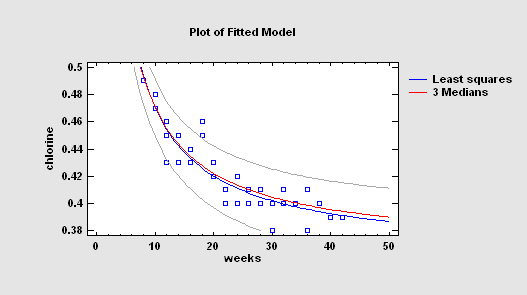
Curve Fitting
The Simple Regression procedure provides 2 alternatives to least squares for fitting linear and nonlinear curves relating Y and X. These include minimizing the sum of the absolute deviations around the fitted curve and Tukey's method of using the medians of 3 groups.