Statistical Analysis
Statgraphics contains nearly 300 procedures covering a wide range of statistical methods. Based on user requests, Version 20 adds several new procedures as described below.
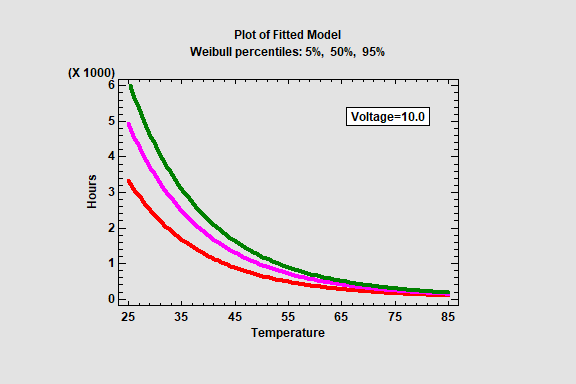
Accelerated Life Testing
When testing items to estimate their failure time characteristics, it is often impossible to observe enough failures under normal operating conditions to obtain reasonable estimates of the failure time distribution. Consequently, one or more factors are often used to stress the items so as to obtain more failures in a sufficiently short time period.
The Accelerated Life Testing procedure fits various types of accelerating models and extrapolates the results to normal operating conditions. In addition to a primary accelerating variable, which must be quantitative, additional predictors may be included in the models and may be either quantitative or categorical. The distribution of failure times may take any of seven different forms, including a Weibull, exponential, normal, lognormal, logistic, loglogistic, or smallest extreme value distribution. Failure times may be censored or uncensored.
The output of the procedure includes an estimate of the survivor function and failure time distribution. Predictions may be calculated from the fitted model and unusual residuals identified.
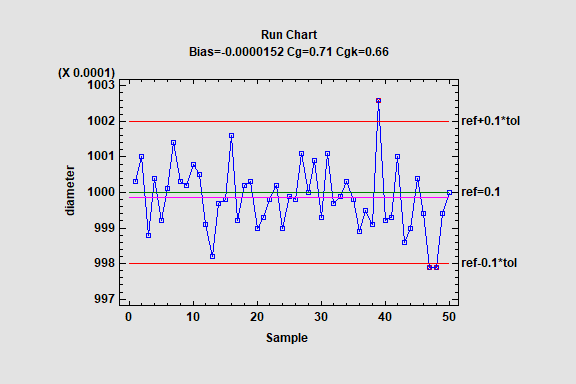
Type 1 Gage Studies
A Type 1 Gage Study analyzes repeated measurements made by an operator on the same item, where the true value of the characteristic being measured is known. It is used to estimate the repeatability and bias of a measurement process before a full Gage R&R study is conducted.
Capability indices called Cg and Cgk compare the variability and bias of the measurements to a known tolerance (distance between upper and lower specification limits).

The primary chart used to display the recorded measurements is a run chart. Ideally, at least 50 measurements should be used for this type of study.
Dissolution Analysis
3 procedures have been added for use in dissolution analysis, which analyzes the rate at which a drug or other substance dissolves. These procedures are used for:
- Dissolution Model Fitting - fits 10 popular dissolution models to data collected from a standard dissolution study.
- Model-Dependent Comparisons - compares the dissolution profiles of one or more test batches to a reference batch using fitted dissolution models.
- Model-Free Comparisons - compares the dissolution profiles of one or more test batches to a reference batch using methods that do not depend on fitting dissolution models.


Levey-Jennings Charts
Levey-Jennings charts have been added to the SPC section of Statgraphics. These charts are widely used in monitoring laboratory data. They are similar to Individuals-X charts except for how sigma is calculated. They also identify usual runs using the Westgard rules rather than the Western Electric rules.

Empirical Capability Analysis
Statgraphics has an extensive collection of procedures for performing a process capability analysis. When capability depends on the value of a numeric variable, a wide varierty of distributions may be fit to the available data. In some cases, none of the available distributions provides an adequate fit. In such cases, the Empirical Capability Analysis procedure may be used to estimate process capability based on the empirical quantiles of the data without assuming any particular distributional form. Nonparametric capability indices called Cnp and Cnpk replace the usual parametric estimates Cp and Cpk.

Nonstationary Capability Analysis
Capability analysis usually assumes that the process being evaluated is stable, i.e., that the mean and standard deviation are constant over time. That is not always true. The Nonstationary Capability Analysis procedure may be used to analyze processes in which the mean and standard devation change over time. This is done using a moving window that estimates the process parameters at time t using the q nearest neighbors. It is implemeneted as a Statlet, allowing the user to dynamically change the value of q. The results are moving estimates of Cpk, DPM and SQL.
